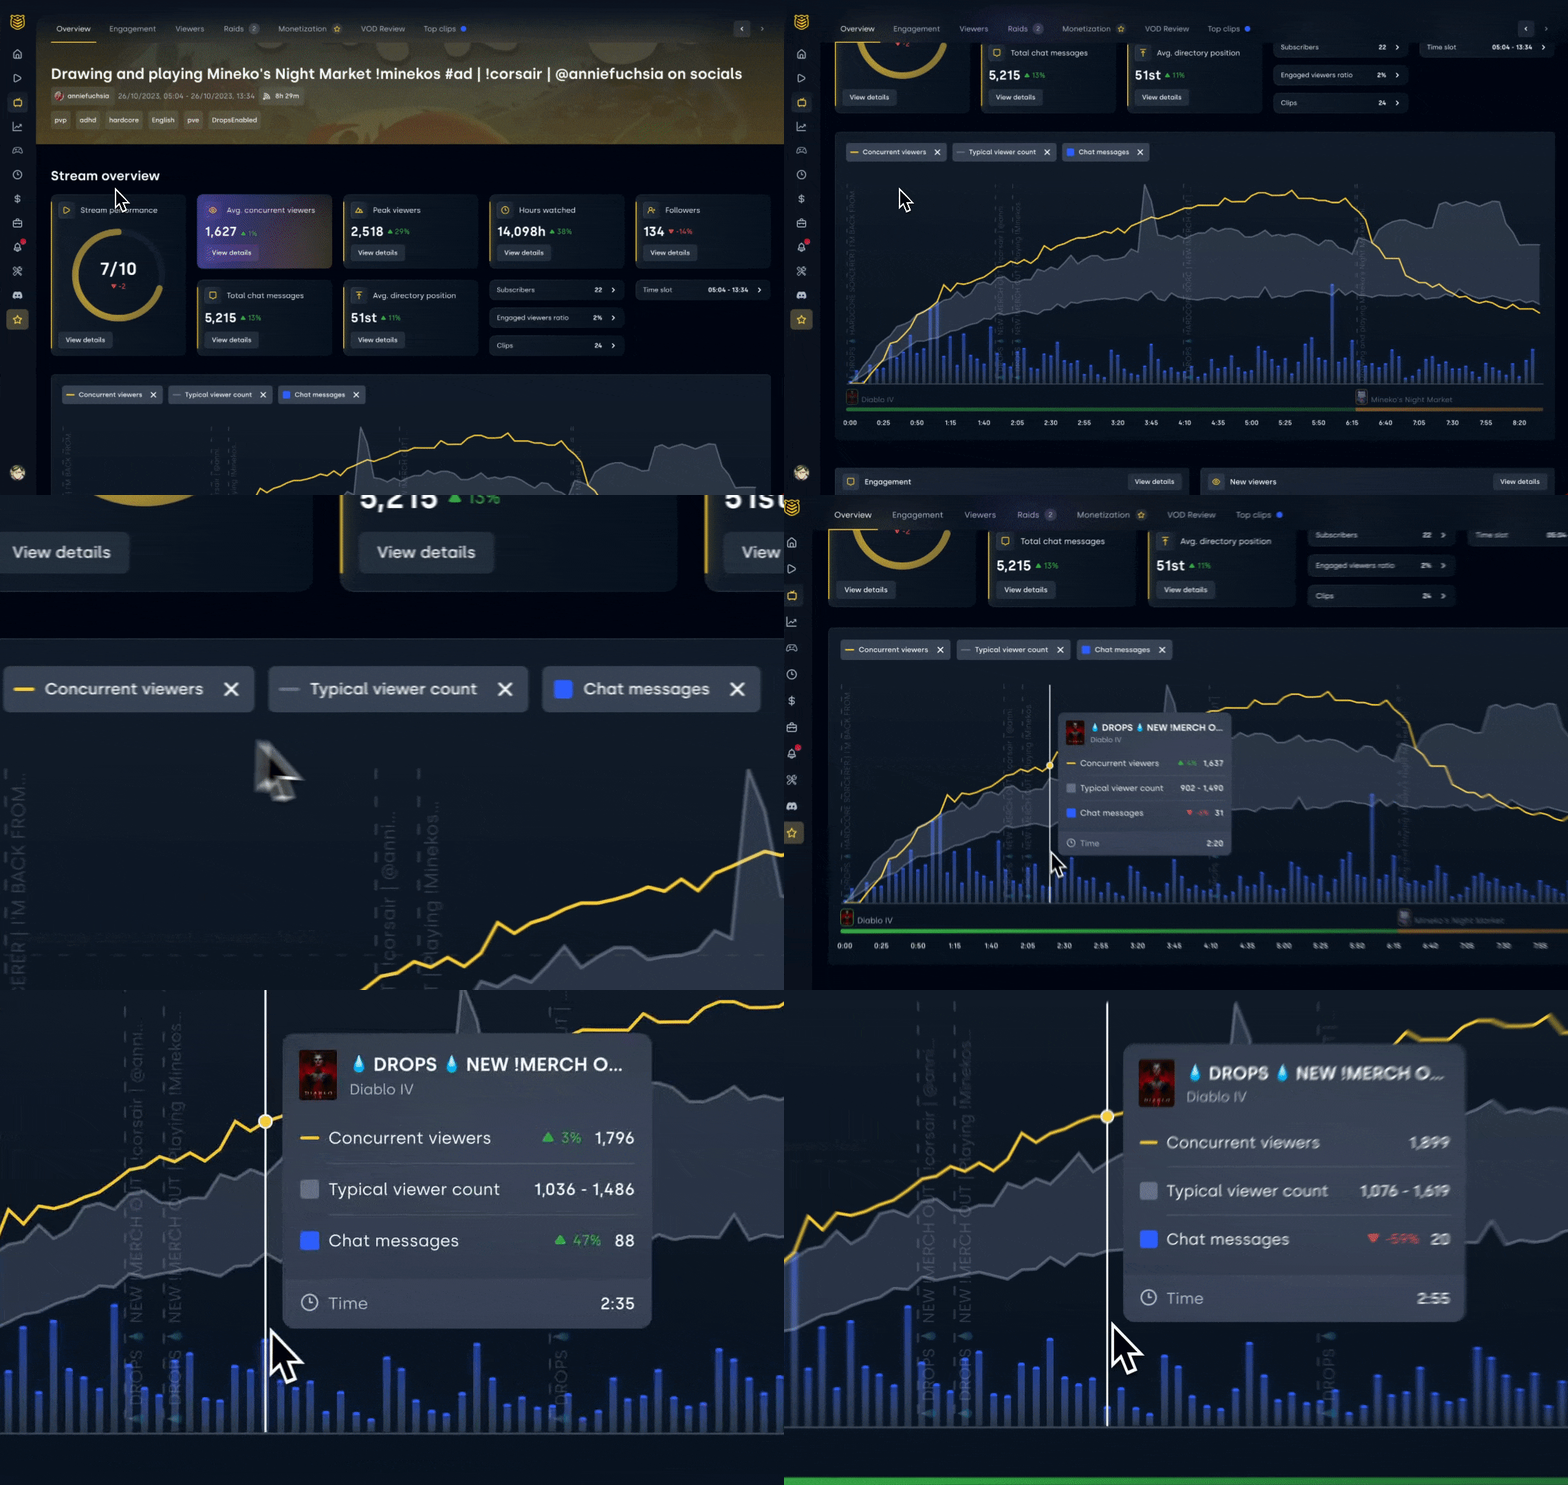
Meet the NEW Overview Tab!
Introducing Typical Viewers Area chart 💥
🚨 Introducing Twitch Typical Viewers chart! 🚨
🧑🔬 Benchmark Your Stream against your Typical views
🗺️ The Grey Area shows the zone of your usual CCV
🍏 Using Data from the past 20 Streams
🍊 Top & Bottom Outliers are automatically Removed
Find this on your Overview Tab.

How to read this chart? 🧠
🔴 1: Yellow line below the grey zone:
This moment had fewer viewers than usual, but no need to stress.
🔵 2: Yellow line in the grey zone:
You've met your standard, well done!
🟢 3: Yellow line above the grey zone:
Excellent, you had a great moment! You had more viewers than usual here.

--------
Also introducing...
These two guys, that you might recognize from your Email Summaries, which you receive after every stream 🙌
A breakdown of New views vs Fans and Lurkers vs Chatters. Find them on the bottom of your Overview tab.

